
ACT Science Prep: Types of Studies to Expect on Test Day
The ACT science section can be intimidated for many students. The biggest reason for this is because it really isn’t all that similar to the science classes students take in high school. In fact, the ACT science section tests students primarily on their ability to analyze and interpret data from various charts, graphs, and texts. There are some key patterns that students can expect from this section on test day. One of those is the format of the studies. Here is what you can expect on test day.

Many students find the ACT science section frustrating, since they aren’t actually required to have scientific knowledge to do well on it. In fact, students are mainly tested on their ability to analyze and interpret data throughout this section.
As with all sections of the ACT, the format is very consistent, and, though you don’t know exactly what topics you’ll be examined on, you do know the format of the different studies. Knowing this, you can plan accordingly and practice the different study types until you are very familiar with both the format of the studies and how to approach them.
There are 3 types of ACT Science studies that you’ll be given the task of analyzing:
1. Data Representation
Data representation studies are all about your ability to understand data presented to you within charts, tables, and graphs. That’s it! These studies DO NOT test you on your knowledge level of the topic of the study; instead, they are only testing your ability to understand what the study data means. You’ll recognize these studies as those that are heavy with bar graphs, scatterplots, and tables. Here is an example:

This study consists of one confusing line graph and a second, simpler line graph. Throughout the questions, you are charged with the task of extracting different data pieces from the two graphs. Although the topic is greenhouse gases, not a single question asks about information found outside the data in the graph. That being said, you do not need to be a greenhouse gas expert by any means. You simply have to be able to pull information out of the datasets. You will do this by paying very close attention to labels and parts of the study, paying close attention to the x axis value, y axis values from both the right and left, and the legend.
Success on these studies depends on your attention to detail and ability to analyze the many aspects of the datasets within the time constraint. If you find that you have difficulty with the time constraint for the science section, consider testing some ACT science big-picture strategies that might help you to work through the section more quickly.
2. Research Summaries
Research summary studies are another type of study you can expect to see on test day. These studies will usually present several related studies or steps within one study to you within the same passage. You’ll often see sections labeled Study 1, Study 2, Study 3, along with some text explanations of the parts of the study. Then the questions will ask you to interpret the design of the studies and the results of the experiment. Here is an example:

In the example above, you see that this particular study is made up of 2 experiments and 3 tables, as well as some text information. Again, you are not required to be an expert on the topic of the study, but now questions could be more broad than data representation studies, as you’re tasked with comparing and contrasting different pieces of the study.
Once again, a key to success on these studies is to pay close attention to where the question tells you to look, taking into account all of the labels.
3. Conflicting Viewpoints
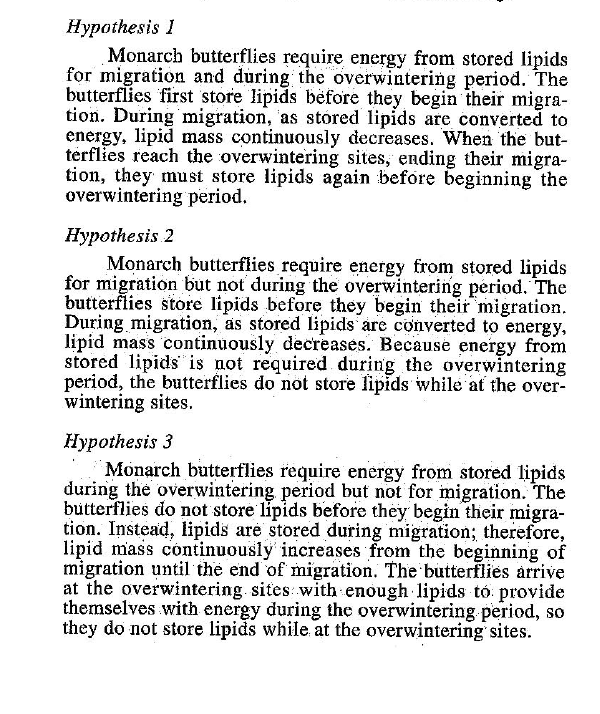
The last type of study that shows up on ACT test day is the conflicting viewpoints study. There will only ever be one conflicting viewpoints study, and it will look a bit different than the other types of studies. This section will be primarily word-based and may not have any charts, tables, or graphs associated with it. This section will give you theories of different students, teachers, scientists, or something similar, and then the questions will require you to compare and contrast these theories. Here is an example:
The questions for this study ask you to determine which hypotheses match up with various ideas about the migration and lipid storage tendencies of monarch butterflies. Doing well on this section will require you to be able to read through the scientific theories and compare and contrast them from one another.
Now that you have an idea of what type of studies show up on the science section, it’s time to consider how you can use this to your advantage. One thing you can do is identify big-picture ACT science strategies to help you reach your best possible score. Similarly, you can use some common ACT science tips and tricks to help you boost your score and productivity.
As with all sections of the ACT, the more familiar you are with the passage, including its format, topics, and question types, the less anxious you will become on test day. That being said, simply reviewing these types of studies and their overall format and question types will leave you more prepared for test day.
Good luck, and happy studying!
INTERESTED IN TUTORING?
Working one-on-one with a test prep & college counseling expert can help you maximize your score on test day and get accepted to your dream school. Whatever your college prep goals, our team can help!
I want to sign up! - Set up online lessons using the link to our scheduling system.
I want more information! - Fill out the information in the link, and someone will reach out soon.